Introduction
With the advancement of IoT technology, automating irrigation systems has become easier than ever. In this blog post, we will explore how to create a smart irrigation system using NodeMCU ESP8266 and the Appwrite platform.
The term "MizunoHana" is a combination of two Japanese words: "Mizuno," meaning water, and "Hana," meaning flower. The name represents the concept of nurturing and caring for plants, which holds great significance in Japanese culture.
Demo
Setup Demo: https://vimeo.com/836417533
Working Demo: https://vimeo.com/836420594
Dashboard Link 🎉🎉: https://mizunohana.netlify.app/
Dashboard Credentials (If you don't want to create an account)
email: admin@gmail.com password: 123123123
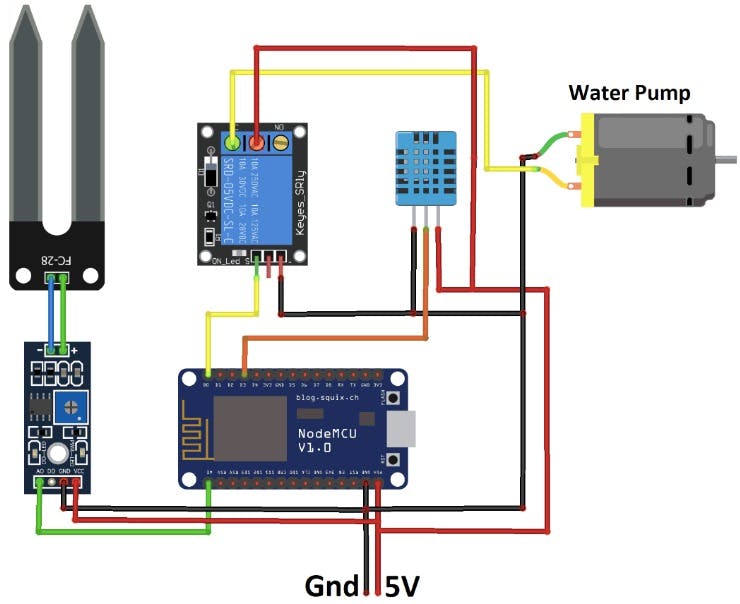
Components
To build our smart irrigation system, we will need the following components:
- NodeMCU ESP8266: A versatile microcontroller board with built-in Wi-Fi capabilities.
- Soil Moisture Sensor Module: Measures the moisture level in the soil.
- Water Pump Module: Controls the water pump for irrigation.
- Relay Module: Acts as a switch to control the high-power water pump.
- DHT11 (optional): A digital temperature and humidity sensor for environmental monitoring.
- Connecting Wires: To establish the necessary connections between the components.
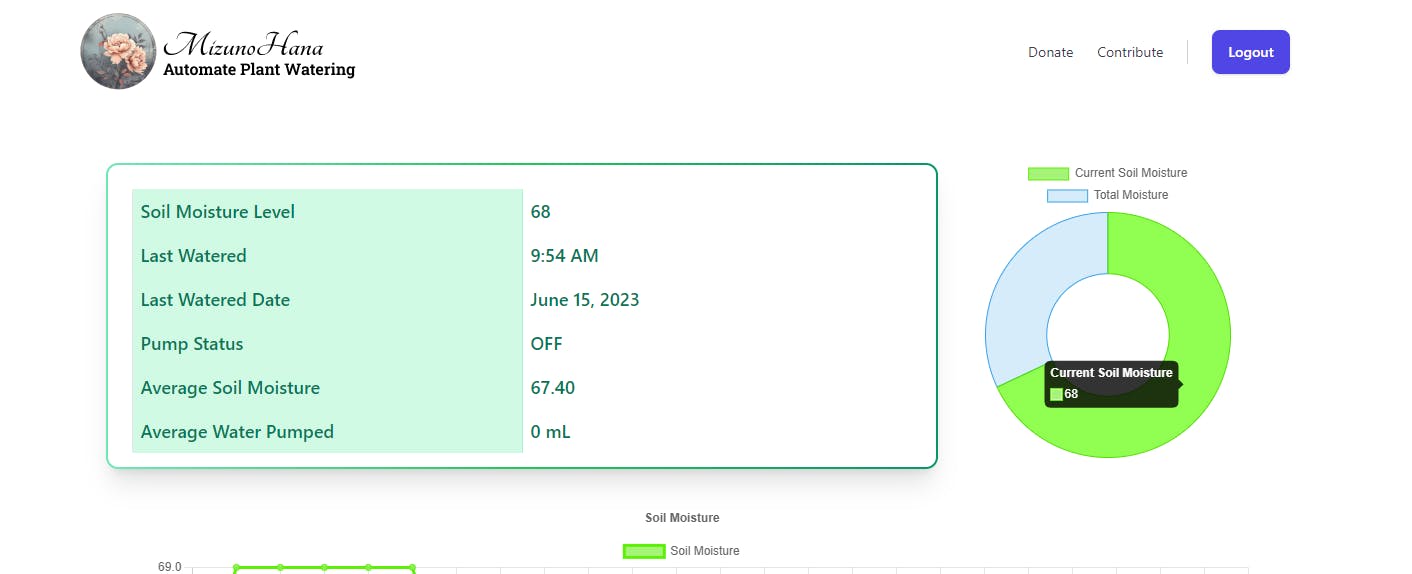
Dashboard
The MizunoHana dashboard gives you a quick summary of important plant care information. Users may simply track soil moisture levels, daily water supplied to the plant, last watering session and date, and pump status. A gauge chart graphically displays the current soil moisture level, allowing for quick and easy plant hydration monitoring. Plant owners may keep informed and provide best care for their plants by using the MizunoHana dashboard.
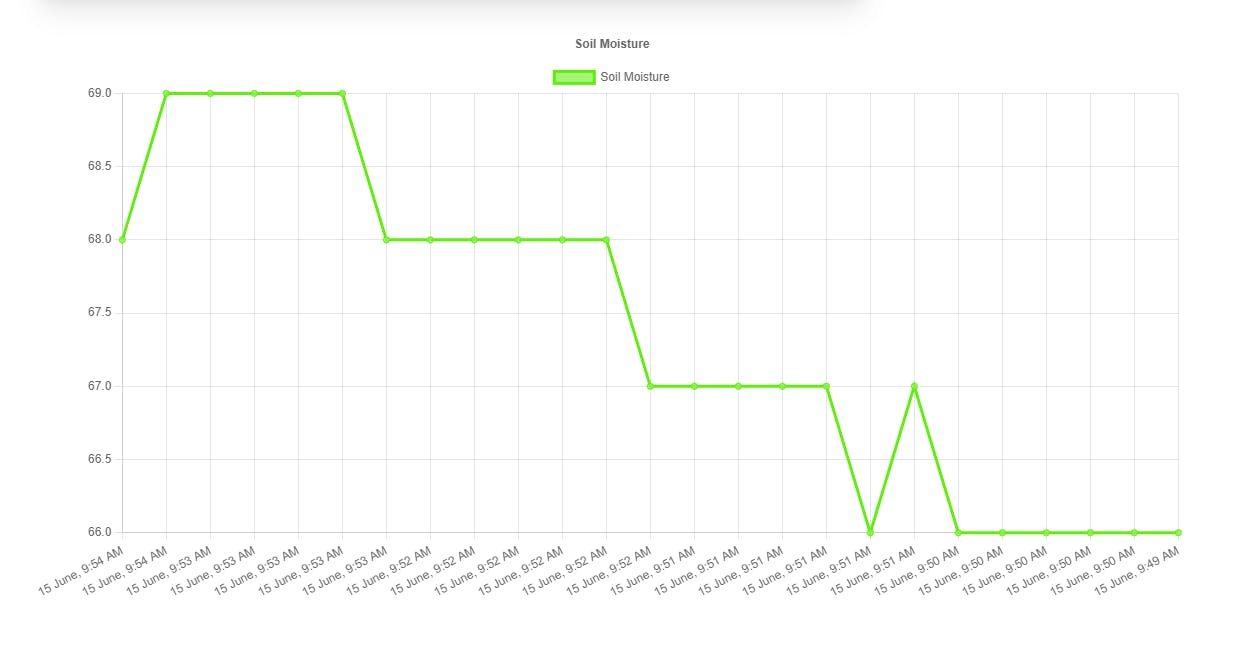
A handy line chart can also be used to analyze soil moisture trends throughout the day. This function enables plant owners to spot patterns and make smart watering decisions.
A handy bar chart allows users to visualise the trends of pump activation throughout the day. A tabular format exposes raw data saved in the database to individuals wanting more specific information, providing a full picture of watering events.
A handy bar chart allows users to visualise the trends of pump activation throughout the day. A tabular format exposes raw data saved in the database to individuals wanting more specific information, providing a full picture of watering events.